
If you’re experiencing lag spikes during gaming, stuttering video calls, or unexplained slowdowns, learning how to test packet loss on Windows 11 is the first step toward diagnosing your network problems. Packet loss occurs when data packets traveling between your device and a server fail to reach their destination, causing everything from minor disruptions to complete connection failures.
Unlike bandwidth or latency issues, packet loss is uniquely disruptive because it forces your system to retransmit data—creating cascading delays that compound over time. A single lost packet in a VoIP call might cause a brief audio dropout, while consistent 2-3% loss can make online gaming nearly unplayable. Windows 11 includes several built-in diagnostic tools specifically designed to measure and trace packet loss, and understanding which tool to use in each scenario makes the difference between guessing and actually solving network problems.
What Packet Loss Is and Why You Should Test It
Packet loss represents the percentage of data packets that never complete their journey from source to destination. When you send a request to a website or game server, your data is broken into small packets, each following potentially different network paths before reassembling at the endpoint. If routers along the path become congested, if network cables are damaged, or if wireless interference disrupts transmission, some packets simply disappear.
This differs fundamentally from high latency, where packets arrive slowly but completely. With packet loss, the data never arrives at all—your system waits for confirmation, times out, then retransmits the missing information. The result is stuttering, freezing, rubberbanding in games, or complete session disconnects.
You should test for packet loss whenever you notice specific symptoms that bandwidth tests don’t explain. If your internet speed test shows 500 Mbps download but your video conference still freezes, packet loss is the likely culprit. Gaming applications are particularly sensitive—most competitive online games become unplayable above 1% sustained packet loss because character positions, inputs, and game state updates fail to synchronize properly.
Common scenarios requiring packet loss testing include sudden degradation in network performance despite unchanged internet speed, intermittent disconnections from VPN or remote desktop sessions, audio/video desync in streaming applications, and rubber-banding or teleporting in multiplayer games. Regular testing also helps identify gradual hardware degradation in routers, modems, or network interface cards before complete failure occurs.
The testing process reveals not just whether you have packet loss, but where it originates. Loss occurring at your router indicates local network problems—potentially fixable through configuration changes or hardware replacement. Loss appearing several hops into your ISP’s network points to infrastructure issues requiring provider intervention. Loss only at the final destination suggests server-side problems entirely outside your control. Understanding this distinction prevents wasting time on fixes that can’t address the root cause.
Built-in Windows 11 Tools to Test Packet Loss
Windows 11 includes three native command-line utilities that require no installation and provide progressively deeper packet loss analysis. Each tool serves a distinct diagnostic purpose—ping offers quick snapshot testing, pathping traces loss across the entire route, and pktmon provides kernel-level packet capture for advanced troubleshooting.
Continuous Ping Test (Fastest Method)
The ping command sends Internet Control Message Protocol (ICMP) echo requests to a target and measures how many return successfully. By default, ping sends only four packets, which isn’t enough to detect intermittent loss patterns. The continuous ping test extends this indefinitely, allowing you to observe loss percentages over meaningful time periods.
To run a continuous ping test, press Win + X and select Terminal (Admin) or Windows PowerShell (Admin). Type the following command, replacing the example IP with your target:
ping 8.8.8.8 -t
The -t flag instructs ping to continue until you manually stop it with Ctrl + C. Google’s public DNS (8.8.8.8) serves as a reliable test target, but you can substitute your game server IP, work VPN endpoint, or any reachable address. Let the test run for at least 5-10 minutes to capture fluctuations that brief tests miss.
When you press Ctrl + C, ping displays summary statistics including packets sent, received, and lost with a calculated loss percentage. Zero lost packets indicates no loss during the test window. Any percentage above 0% warrants further investigation, though occasional single-packet losses (<0.5%) can occur even on healthy networks due to transient conditions.
For structured testing intervals, use ping 8.8.8.8 -n 500 to send exactly 500 packets then stop automatically. This approach standardizes tests for comparison—running the same 500-packet test at different times of day reveals whether loss correlates with network congestion periods.
Pathping Command (Find Where Loss Starts)
While ping confirms packet loss exists, pathping identifies exactly where along the network path the loss begins. This command combines traceroute functionality with extended ping testing at each hop, revealing whether problems originate in your local network, your ISP’s infrastructure, or the destination network.
Pathping operates in two phases—first it traces the route to the destination (similar to tracert), then it spends 25 seconds per hop sending packets to calculate loss statistics. The complete test takes several minutes depending on hop count, but provides unmatched diagnostic detail.
Run pathping from an administrator terminal:
pathping 8.8.8.8
The initial output displays each router hop between your computer and the target. After route discovery completes, pathping begins the testing phase, indicated by “Computing statistics for X seconds…” Once finished, the statistics table shows loss percentages at each individual hop.
The critical column is the rightmost “Lost/Sent = Pct” which shows packet loss percentage specifically introduced at that hop. Loss at hop 1 (your gateway/router) indicates local network issues. Loss first appearing at hop 3-5 typically points to your ISP’s infrastructure. Loss only at the final destination suggests the target server or its immediate network has problems.
One crucial interpretation detail: cumulative loss percentages can appear misleading. If hop 5 shows 10% loss but hop 6 shows 0%, the loss exists at hop 5 specifically—later hops simply inherit that existing loss. Focus on where loss first appears rather than cumulative totals. For a deeper understanding of how to use ping commands effectively for network diagnostics, see our guide on Ping Command for Internet Troubleshooting.
Pktmon (Advanced Packet Monitor)
Pktmon is a built-in packet sniffer introduced in Windows 10 version 1809 and enhanced in Windows 11, offering capabilities previously requiring third-party tools like Wireshark. Unlike ping and pathping which only test ICMP packets, pktmon captures actual application traffic—TCP connections, UDP streams, DNS queries—making it invaluable for diagnosing application-specific packet loss.
To start basic packet monitoring, open Terminal as administrator and run:
pktmon start --etw -p 0
This begins capturing all packets with no size limit (-p 0). Let it run while you reproduce the network issue—launch your game, start a video call, or perform whatever activity experiences problems. Stop capture with:
pktmon stop
Convert the captured data to readable format:
pktmon format PktMon.etl -o packet-log.txt
The resulting text file contains detailed packet information including drop reasons. Search for “Drop” entries to identify which packets were discarded and why—common reasons include buffer overflow (congestion), policy violations (firewall rules), or malformed packets (driver issues).
For targeted application monitoring, filter by specific ports. If testing a game using UDP port 27015:
pktmon filter add -p 27015 -t UDP
Then start monitoring. This focused approach reduces file size and simplifies analysis by capturing only relevant traffic.
Pktmon’s learning curve is steeper than ping or pathping, but it reveals packet loss that ICMP-based tools miss. Some routers deprioritize or block ICMP entirely while passing application traffic normally, making ping tests unreliable. Pktmon bypasses this limitation by analyzing the actual protocols your applications use.
How to Read Your Test Results
Understanding the raw numbers from packet loss tests requires context—a 2% loss rate might be catastrophic for one application but acceptable for another, and interpreting where loss occurs matters as much as the percentage itself. Reading results correctly prevents both overreacting to harmless fluctuations and underestimating serious degradation.
What Different Loss Percentages Mean
Packet loss severity depends on both the percentage and the application type. Zero percent loss represents the ideal state where all transmitted packets reach their destination successfully. This is what you should expect on stable wired connections during normal operation, though achieving absolute zero over extended periods isn’t always realistic due to occasional transient network conditions.
Loss between 0.1% and 0.5% falls within acceptable tolerance for most applications. Brief microburst congestion, router buffer management, or wireless interference can cause occasional single-packet drops that self-correct without noticeable impact. Web browsing and file downloads handle this range transparently through automatic retransmission. Video streaming services with adequate buffering won’t display visible artifacts. However, even this minimal loss becomes perceptible in latency-sensitive applications like competitive gaming or live trading platforms.
Loss from 1% to 2.5% creates noticeable quality degradation. VoIP calls develop audio dropouts and robotic voice distortion. Video conferences show frozen frames and lip-sync issues. Online games exhibit rubberbanding where your character position resets suddenly as the client reconciles with delayed server updates. Remote desktop sessions become sluggish with screen refresh delays. If your tests consistently show this range, you have a legitimate problem requiring investigation.
Loss above 5% indicates severe network impairment where normal operation becomes difficult or impossible. Sustained loss at this level causes frequent disconnections from game servers, complete audio/video breakdown in conferencing, and VPN tunnel instability. Web pages may fail to load completely as TCP connections struggle to maintain state. At 10% or higher, most real-time applications become entirely unusable.
Context matters critically when evaluating these thresholds. A single pathping test showing 1% loss at 3 AM means something different than consistent 1% loss during peak evening hours. Intermittent spikes to 5% lasting 30 seconds suggest congestion patterns, while sustained 5% loss regardless of time indicates hardware failure or infrastructure damage.
When Packet Loss Is a Real Problem
Not all detected packet loss requires immediate action—distinguishing between measurement artifacts, acceptable transient conditions, and genuine problems prevents wasted troubleshooting effort on non-issues.
Loss appearing exclusively at the final hop in pathping results often represents ICMP rate limiting rather than actual packet loss. Many servers deliberately deprioritize or discard ICMP echo requests to conserve resources for real traffic. If pathping shows 50% loss at the destination but intermediate hops show 0%, and your application works normally, the “loss” is an artifact of how the target handles ping packets. Your actual application data isn’t affected.
Similarly, single isolated packet drops during continuous ping tests don’t necessarily indicate problems. Networks occasionally discard packets during legitimate operations like routing table updates or brief congestion events. If a 1000-packet ping test shows one or two losses (0.1-0.2%) but the pattern doesn’t repeat in subsequent tests, you’re observing normal network behavior rather than systemic issues.
Real problems reveal themselves through consistency and correlation with symptoms. If you experience game lag every evening between 7-10 PM and pathping during those hours shows 3% loss starting at hop 4 (your ISP’s network), you’ve identified a legitimate congestion issue. If video calls freeze randomly and continuous ping tests running simultaneously show loss spikes matching the freezes, packet loss is definitively the cause.
Location of loss determines whether you can fix it. Loss at hop 1 (your router/gateway) is within your control—updating firmware, replacing Ethernet cables, changing WiFi channels, or upgrading router hardware may resolve it. Loss first appearing at hop 2-5 (your ISP’s infrastructure) requires contacting your provider with test evidence. Loss only at distant hops beyond your ISP suggests internet backbone congestion or destination network issues outside your influence.
Time-based patterns provide additional diagnostic clues. Loss occurring only during specific hours points to congestion from network utilization peaks. Loss that worsens progressively over days or weeks suggests hardware degradation. Random sporadic loss without time correlation often indicates wireless interference or failing cable connections.
Once you’ve confirmed packet loss exists, identified where it originates, and ruled out measurement artifacts, you can proceed with targeted solutions. For comprehensive fixes based on different loss scenarios, refer to our detailed guide on How to Fix Packet Loss on Windows 11.

Best Third-Party Tools for Windows 11
While Windows 11’s built-in utilities provide solid diagnostic capabilities, third-party tools offer continuous monitoring, visual trend analysis, and automated logging that command-line tools can’t match. These applications excel at capturing intermittent issues that appear and disappear before you can run a manual test, and their graphical interfaces make pattern recognition significantly easier than parsing text output.
WinMTR – Real-Time Monitoring
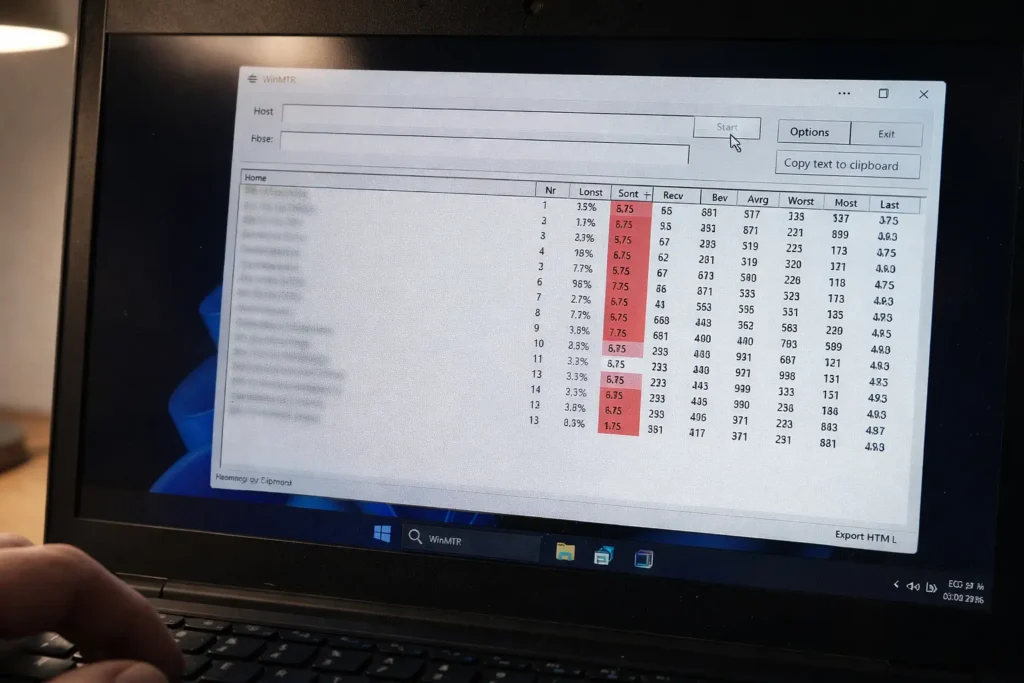
WinMTR combines the route-tracing functionality of pathping with continuous real-time updates in a lightweight graphical interface. Unlike pathping which takes several minutes to complete a single test, WinMTR displays live statistics that update every second, allowing you to observe packet loss as it happens rather than waiting for delayed summary reports.
Download WinMTR from the official WinMTR site, extract the ZIP file, and run the executable—no installation required. The interface shows a simple text field for your target hostname or IP address. Enter your destination (game server, work VPN, or test target like 8.8.8.8) and click Start.
The results table updates continuously, displaying each hop along the route with columns for sent packets, received packets, loss percentage, best/average/worst latency, and current last reading. The loss percentage column is your primary diagnostic indicator—watch for values above 0% and note which hop first exhibits loss.
WinMTR’s key advantage over pathping is temporal visibility. You can leave it running during your entire gaming session or workday, capturing intermittent loss events that snapshot tests miss. If packet loss correlates with specific activities—joining a voice chat channel, starting a video stream, or when your roommate begins streaming Netflix—WinMTR’s live updating reveals the exact moment loss begins.
The Export TEXT button saves results for documentation when contacting your ISP. The exported data includes comprehensive statistics showing minimum, maximum, and average loss percentages across the entire monitoring period, providing concrete evidence of network problems rather than anecdotal reports.
One limitation: WinMTR only monitors ICMP packets, so it shares pathping’s vulnerability to ICMP rate limiting at certain hops. For most scenarios this doesn’t matter, but if you need application-specific traffic analysis, pktmon or commercial tools become necessary.
PingPlotter – Visual Graphs
PingPlotter transforms raw packet loss data into timeline graphs that make patterns immediately obvious. While WinMTR shows current statistics, PingPlotter maintains historical graphs plotting loss and latency over hours or days, revealing trends invisible in numerical tables.
Download PingPlotter from the official PingPlotter site—the free version provides essential functionality for home users, while paid versions add advanced features like automated alerting. After installation, enter your target address and click Start. PingPlotter begins collecting data and building visual timelines.
The interface splits into three primary sections. The upper timeline graph displays packet loss and latency over time with color-coded severity (green = good, yellow = degraded, red = severe). The middle route list shows each hop similar to WinMTR. The lower focus graph displays detailed statistics for whichever hop you select, allowing deep analysis of specific problematic routers.
PingPlotter’s temporal visualization excels at identifying patterns. If you see regular red spikes on the timeline every evening at 7 PM, you’ve identified congestion tied to peak usage hours. If loss appears as random scattered red marks without temporal pattern, you’re dealing with intermittent hardware issues or wireless interference. If the graph shows gradually increasing loss over days, hardware degradation is the likely cause.
The tool’s ability to monitor multiple targets simultaneously helps isolate whether problems are route-specific or systemic. Create separate monitoring sessions for different game servers, your ISP’s gateway, and public DNS servers. If all targets show simultaneous loss, your local network or ISP connection is the problem. If only specific destinations exhibit loss, the issue lies with those particular routes.
PingPlotter’s summary reporting generates professional documentation useful when escalating issues to ISP technical support. Rather than describing “my internet is laggy sometimes,” you can provide exported graphs showing “3-5% packet loss occurring at hop 4 (ISP network) daily between 19:00-22:00 UTC” with visual evidence spanning multiple days.
When to Use Which Tool
Selecting the appropriate testing tool depends on your specific diagnostic scenario and technical comfort level. Use the built-in ping command for quick initial verification—if you suspect packet loss right now and need immediate confirmation, ping -t provides an answer within 60 seconds. This is your first-response tool when troubleshooting begins.
Deploy pathping when you’ve confirmed loss exists and need to locate where it originates. If ping shows 2% loss but you don’t know whether to troubleshoot your router, contact your ISP, or blame the destination server, pathping answers that question definitively. Run it once, wait for completion, interpret the hop-by-hop results, then proceed with targeted fixes.
Switch to WinMTR for intermittent issues that appear unpredictably. If packet loss happens “sometimes” but you can’t identify the trigger, leave WinMTR running continuously while you use your network normally. When symptoms appear, check WinMTR immediately to see if loss correlates with the problem. This tool bridges the gap between manual testing and automated monitoring.
Choose PingPlotter when you need historical analysis or professional documentation. If your ISP claims “we don’t see any problems” despite your experience indicating otherwise, PingPlotter’s multi-day graphs provide irrefutable evidence of patterns. It’s also the best choice for understanding long-term trends like whether your network quality is degrading over weeks.
For application-specific issues where ICMP-based tools show no loss but you still experience problems, return to pktmon for protocol-level capture. Some applications use UDP in ways that fail even when ping succeeds, and some routers treat ICMP differently than actual traffic.
Keep in mind that packet loss often appears alongside other network issues. If your tests show both packet loss and high latency spikes, addressing the loss may not fully resolve performance problems. For comprehensive network health, also check for high jitter issues which cause variable latency, and investigate persistent high latency that compounds loss-related disruptions.
Frequently Asked Questions
How do I test packet loss on Windows 11?
Open Terminal or PowerShell as administrator and run ping 8.8.8.8 -t for continuous testing, or use pathping 8.8.8.8 to identify where loss occurs along the network route. Let ping run for at least 5-10 minutes, then press Ctrl + C to view loss statistics. For ongoing monitoring, download WinMTR or PingPlotter to track packet loss visually over extended periods. These tools provide real-time updates that reveal intermittent loss patterns missed by single snapshot tests.
What is acceptable packet loss on Windows 11?
Zero percent packet loss is the ideal target for any network connection. Loss between 0-0.5% is generally acceptable for most applications including web browsing and video streaming. Gaming and VoIP applications become noticeably degraded at 1-2% loss, with stuttering audio and rubberbanding movement. Anything above 3% indicates serious network problems requiring immediate investigation. Sustained loss above 5% makes real-time applications nearly unusable.
Is 1% packet loss bad for gaming on Windows 11?
Yes, 1% packet loss significantly impacts competitive gaming. While web browsing and streaming tolerate this level through buffering and retransmission, fast-paced games require every positional update to arrive intact. One percent loss causes rubberbanding where your character position resets unexpectedly, shots don’t register correctly, and opponent movements appear jerky. Professional esports players consider anything above 0.5% unacceptable, and casual players will notice performance degradation at 1% during critical gameplay moments.
How to use WinMTR to test packet loss on Windows 11?
Download WinMTR from the official source, extract the ZIP file, and run the executable without installation. Enter your target IP or hostname in the text field—use your game server address, 8.8.8.8 for Google DNS, or 1.1.1.1 for Cloudflare. Click Start and let it run for at least 10-15 minutes to capture meaningful data. Watch the “Loss %” column for any hop showing values above 0%. The hop where loss first appears indicates the problem location. Click “Export TEXT” to save results when documenting issues for ISP support tickets.
What does packet loss at hop 1 mean?
Packet loss at hop 1 indicates problems with your local gateway—typically your router or modem. This is actually good news diagnostically because hop 1 issues are within your direct control to fix. Common causes include outdated router firmware, overheating hardware, damaged Ethernet cables, WiFi interference, or router resource exhaustion from too many connected devices. Try rebooting your router, updating firmware, switching from WiFi to wired connection, or replacing Ethernet cables. If loss persists at hop 1 after these steps, the router hardware itself may be failing and require replacement.
Can I test packet loss without downloading any tool?
Yes, Windows 11 includes built-in tools requiring no downloads. Open Terminal or PowerShell and use ping -t for continuous basic testing or pathping for hop-by-hop analysis. These native commands provide all essential packet loss diagnostic functionality. The built-in pktmon tool offers advanced packet capture capabilities previously requiring third-party software. While downloaded tools like WinMTR and PingPlotter add convenience through graphical interfaces and historical graphing, they’re not mandatory for accurate packet loss testing.
Why do I have packet loss only in games on Windows 11?
Game-specific packet loss while other applications work normally typically indicates UDP traffic handling issues rather than general network problems. Most games use UDP protocol for real-time data while web browsers use TCP. Some routers or ISPs apply traffic shaping that deprioritizes UDP packets during congestion, or firewall rules may interfere with game ports specifically. Quality of Service (QoS) settings on your router might be incorrectly configured, starving game traffic of bandwidth. Test with pktmon filtering for your game’s specific UDP ports to confirm the protocol-specific nature of the loss, then adjust router QoS settings or firewall rules accordingly.
Additionally, consider testing for bufferbloat—a specific congestion issue affecting real-time applications more severely than downloads. The Waveform Bufferbloat Test can reveal if excessive router buffering causes game-specific issues. You can also use Cloudflare’s Speed Test which measures packet loss alongside traditional speed metrics, providing a comprehensive view of your connection quality under load.
How accurate is the built-in ping test for packet loss?
The built-in ping test is highly accurate for detecting ICMP packet loss, but has limitations. It reliably measures whether basic network connectivity has loss issues and provides valid diagnostic data for most scenarios. However, ping only tests ICMP echo protocol—some routers and servers deliberately rate-limit or deprioritize ICMP traffic while treating application data normally. This can create false positives where ping shows loss but your applications work fine, or false negatives where ping succeeds but UDP-based games still experience packet drops. For comprehensive accuracy, combine ping tests with pathping for route analysis and pktmon for application-specific traffic monitoring. Running tests to multiple different targets also improves accuracy by revealing whether loss is route-specific or systemic.
Testing packet loss on Windows 11 requires understanding which tool matches your diagnostic scenario. Use ping for quick verification, pathping to locate problem origins, pktmon for application-specific analysis, and third-party tools for continuous monitoring and historical trending. Interpreting results correctly—distinguishing between measurement artifacts and genuine network problems, understanding acceptable thresholds for different applications, and identifying whether loss occurs locally or upstream—determines whether you waste time on ineffective fixes or resolve issues efficiently.
When packet loss originates at hop 1, you control the solution through router configuration, hardware replacement, or connection optimization. Loss appearing in your ISP’s network requires escalation with documented evidence from multi-day monitoring tools. Loss only at destination hops often lies outside your control entirely. Accurate testing provides the diagnostic clarity needed to focus troubleshooting effort where it matters, whether that means reconfiguring local network hardware, demanding ISP infrastructure repairs, or accepting that some server-side issues simply require waiting for the destination network to resolve their problems.