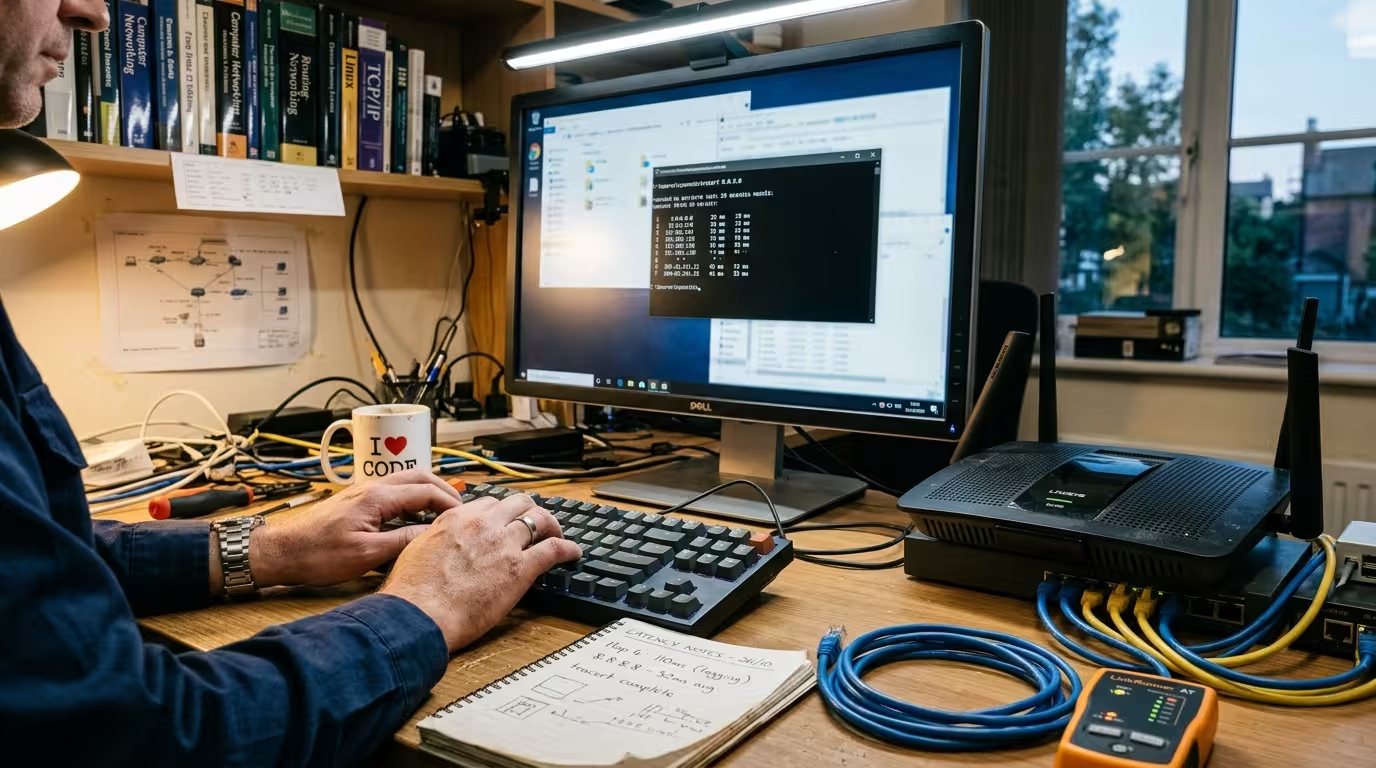
When your internet feels slow or a website refuses to load, running tracert in Windows gives you a map of every router your data passes through on its way to the destination. The problem is that most people run the command, see a wall of numbers, asterisks, and IP addresses, and have no idea what any of it means.
This guide breaks down how to read tracert results in Windows so you can identify exactly where a connection problem is happening — whether it is your local network, your ISP, or something beyond your control.
What Tracert Actually Does — and How It Is Different from Ping
Tracert — short for “trace route” — sends a series of small packets toward a destination and records every router (hop) those packets pass through along the way. It does this by manipulating the TTL (Time to Live) value in each packet. The first packet is sent with a TTL of 1, which means the very first router in the path will discard it and send back an error message. Tracert records that router’s IP and response time. Then it sends another packet with a TTL of 2, reaching the second router, and so on until the packet finally reaches the destination or the maximum hop count is hit.
The result is a complete path listing — every device between your computer and the target — along with timing data for each one.
Ping vs Tracert — Which One to Use and When
Ping tells you whether a destination is reachable and how long the round trip takes. It gives you a single latency number but reveals nothing about the route your data follows. Tracert, on the other hand, shows every intermediate step. If ping tells you the destination is slow, tracert tells you where along the path the slowdown is occurring.
Use ping first to confirm there is a connectivity or latency issue. Then use tracert to pinpoint the exact location. If you want a broader walkthrough of testing with ping, the ping command troubleshooting guide covers that process in detail.
Tracert vs Traceroute — What Is the Difference on Windows
On Windows, the command is tracert. On Linux and macOS, the equivalent command is traceroute. The core concept is identical — both trace the path to a destination hop by hop. The key difference is the protocol used. Windows tracert sends ICMP Echo Request packets by default, while Linux traceroute typically uses UDP packets. This protocol difference can occasionally produce slightly different results when routers along the path treat ICMP and UDP traffic differently. For Windows users, tracert is the only built-in option and it works directly from Command Prompt or PowerShell without any installation.
How to Run Tracert on Windows 11
Running tracert on Windows 11 takes a single command. Open the Start menu and type cmd, then click Command Prompt. Alternatively, right-click the Start button and select Terminal to open PowerShell — tracert works in both.
At the prompt, type:
tracert 8.8.8.8Press Enter. The command will begin printing hop-by-hop results in real time. Each line appears as the corresponding router responds, so a full trace can take anywhere from a few seconds to over a minute depending on the number of hops and whether any routers are slow to respond. You can also trace a domain name instead of an IP address — for example, tracert google.com — and Windows will resolve the domain automatically before starting the trace.
To cancel a running trace at any point, press Ctrl + C.
How to Read Tracert Output Line by Line
Once the trace completes, the output may look intimidating at first glance, but every line follows the same predictable structure. Understanding that structure is the key to reading tracert results on any Windows machine.
What the First Line Means — Target Name and IP Address
The very first line of output is not a hop. It is a summary line that confirms what you are tracing and how many hops tracert will attempt before giving up. It looks something like this:
Tracing route to dns.google [8.8.8.8]
over a maximum of 30 hops:
This tells you the resolved hostname (dns.google), the IP address (8.8.8.8), and that tracert will try up to 30 hops before stopping. If you traced a domain name, this line confirms the IP it resolved to. If you traced an IP directly, Windows may still perform a reverse DNS lookup and display the hostname. The default 30-hop limit is almost always enough — most internet destinations are reached within 15 to 20 hops.
What Each Hop Row Means — Hop Number, Three Times, IP Address
After the summary line, every subsequent line represents a single hop — one router or network device between your computer and the destination. A typical hop row looks like this:
3 12 ms 9 ms 11 ms 203.0.113.45Reading left to right:
- 3 — The hop number. Hop 1 is usually your local router (default gateway). Each number after that represents the next device in the path.
- 12 ms / 9 ms / 11 ms — Three separate round-trip time measurements in milliseconds.
- 203.0.113.45 — The IP address (and sometimes hostname) of the router that responded at this hop.
This format stays consistent for every hop in the trace. Once you recognize it, the entire output becomes readable at a glance.
What the Three Time Values on Each Hop Mean
Tracert sends three separate packets to each hop and records the round-trip time for each one individually. That is why you see three time columns instead of one. These values represent latency — the time it takes for a packet to travel from your machine to that specific router and back.
Three measurements exist so you can spot inconsistency. If all three values are close together — say 10 ms, 11 ms, 9 ms — the hop is responding consistently. If one value spikes dramatically while the others stay low — for example, 10 ms, 10 ms, 180 ms — that single spike usually indicates a momentary delay rather than a persistent problem. When all three values are consistently high, that is when you should pay closer attention.
What a Normal Tracert Result Looks Like
A healthy trace to a public DNS server like Google DNS 8.8.8.8{:target=”_blank” rel=”nofollow”} typically shows a gradual increase in latency from hop to hop. The first hop — your local router — usually responds in under 5 ms. The next few hops within your ISP’s network might range from 5 ms to 20 ms. As the packets cross regional or international networks, latency climbs to 30–80 ms or more depending on physical distance. The final hop shows the destination responding, and its latency represents the total round-trip time.
A normal trace has no rows full of asterisks, no massive unexplained spikes that carry through to every subsequent hop, and the final hop responds with a reasonable time. Here is a simplified example of a clean result:
  1     1 ms     1 ms     1 ms  192.168.1.1
  2     8 ms     9 ms     8 ms  10.0.0.1
  3    12 ms    11 ms    12 ms  203.0.113.1
  4    25 ms    24 ms    25 ms  198.51.100.10
  5    28 ms    27 ms    28 ms  dns.google [8.8.8.8]
Each hop responds, latency increases gradually with distance, and the destination is reached. When your results deviate from this pattern — asterisks appearing, latency spiking, or hops timing out — that is when the diagnostic value of tracert becomes clear.
What Each Tracert Symbol and Result Means
Not every tracert output comes back clean. Asterisks, timeout messages, and latency spikes are common — but they do not always mean something is broken. Knowing what each symbol actually indicates separates useful diagnosis from unnecessary panic.
Asterisk ( * ) — What It Means and When to Worry
An asterisk in place of a time value means that particular packet received no response within the timeout window. A hop line might look like this:
4 * 15 ms 14 ms 203.0.113.50In this case, the first packet got no reply, but the second and third came back normally. This is almost always harmless. The router at that hop may have deprioritized the ICMP response or was briefly busy handling other traffic. A single asterisk among normal values is not a sign of packet loss on your connection.
Where asterisks do matter is when an entire row shows three of them and every row after that also shows three asterisks. That pattern usually indicates a routing failure or a firewall blocking all ICMP traffic beyond that point.
Request Timed Out on a Hop — Is It a Problem?
When all three packets at a hop fail to get a response, tracert prints:
5 * * * Request timed out.This looks alarming, but a single “Request timed out” row surrounded by normal hops above and below it is usually not a problem. Many routers — especially those operated by large ISPs and backbone providers — are configured to silently drop ICMP packets to reduce processing overhead. The router is still forwarding your actual data just fine; it simply refuses to respond to tracert probes.
The critical test is whether the hops after the timed-out row continue with normal latency and the final destination still responds. If they do, the timed-out hop is not causing any issue. If you frequently encounter timeout messages during regular ping tests as well, the ping request timed out troubleshooting guide explains what to check on your own machine.
Destination Host Unreachable in Tracert
Occasionally a hop does not time out silently but instead returns a “Destination host unreachable” message. This means a router along the path actively reported that it has no valid route to forward your packet toward the destination. Unlike a timeout — where the router simply ignores the probe — this is an explicit failure message.
Common causes include misconfigured routing tables, a downed network segment between providers, or an incorrect IP address that does not exist on any reachable network. If this message appears at the first hop, the problem is likely between your computer and your default gateway. The destination host unreachable fix guide walks through local causes and solutions for that specific scenario.
High Latency Numbers on One Hop Only
Sometimes a single hop in the middle of the trace shows unusually high latency while every hop after it returns to normal:
  3    11 ms    12 ms    10 ms  203.0.113.1
  4   140 ms   135 ms   142 ms  198.51.100.5
  5    26 ms    25 ms    27 ms  198.51.100.10
  6    29 ms    28 ms    30 ms  dns.google [8.8.8.8]
Hop 4 shows 140 ms, but hop 5 and beyond drop back to normal. This almost always means the router at hop 4 is deprioritizing ICMP replies — it handles your actual traffic at full speed but responds to tracert probes slowly because those probes are processed by the router’s control plane, not its fast forwarding hardware. This is one of the most misunderstood patterns in tracert output. A spike on one hop that does not carry forward is usually not affecting your real-world connection speed.
High Latency That Continues on All Remaining Hops
The pattern that genuinely indicates a problem is when latency jumps at a specific hop and stays elevated for every hop after it:
  3    11 ms    10 ms    12 ms  203.0.113.1
  4   145 ms   150 ms   148 ms  198.51.100.5
  5   147 ms   152 ms   149 ms  198.51.100.10
  6   150 ms   155 ms   153 ms  dns.google [8.8.8.8]
Here, hop 4 introduces roughly 135 ms of additional latency, and that increase persists through every remaining hop including the destination. This means the network link between hop 3 and hop 4 is genuinely congested, overloaded, or routing through a physically distant path. Every packet passing through that link inherits the delay. This is the pattern you are looking for when trying to identify the source of slow internet — the hop where latency jumps and never recovers is where the bottleneck lives.
How to Find Exactly Where Your Internet Is Slow Using Tracert
The real diagnostic power of tracert comes from using it systematically rather than just glancing at the output. The following steps walk you through the process of isolating exactly where a slowdown occurs in your connection path.
Step 1 — Run Tracert to 8.8.8.8
Open Command Prompt or Terminal on your Windows machine and run:
tracert 8.8.8.8Using a well-known public DNS IP removes the destination server itself as a variable. Google’s DNS infrastructure is globally distributed and almost never the cause of latency. You can also run a second trace to Cloudflare DNS 1.1.1.1{:target=”_blank” rel=”nofollow”} for comparison. If both traces show similar latency spikes at the same hop, the problem is clearly in the path — not at the destination.
Let the trace complete fully. Do not cancel it early, because the hops after a spike are what tell you whether the issue is real or cosmetic.
Step 2 — Find the First Hop With High Latency
Scan the output from top to bottom and look for the first hop where latency increases significantly and stays high on all following hops. Ignore isolated spikes that recover on the next line — as explained earlier, those are almost always routers deprioritizing ICMP replies.
What you are looking for is a clear jump. If hops 1 through 4 all show latency under 15 ms and then hop 5 suddenly reports 120 ms with every hop after it staying above 110 ms, hop 5 is where the bottleneck begins. The network link between hop 4 and hop 5 is introducing the delay.
Step 3 — Is the Problem Before or After Your ISP
Once you identify the problem hop, the next question is ownership. The first hop is your local router. The next two to four hops are typically within your ISP’s network. Beyond that, traffic passes through transit providers and backbone networks before reaching the destination.
If the latency spike happens at hop 1, the issue is between your computer and your router — a local network problem. Check your Wi-Fi signal, Ethernet cable, or router itself. If you cannot ping your default gateway at all, the problem is even more fundamental.
If the spike occurs within hops 2 through 4, the issue is likely inside your ISP’s infrastructure. This is especially common during evening hours when ISP networks become congested with peak traffic. The internet slows down at night guide explains why this pattern happens and what you can realistically do about it.
If the spike occurs well beyond your ISP’s hops — say hop 8 or later — the congestion is in a transit network or backbone link that neither you nor your ISP directly controls. In this case, the issue often resolves on its own as traffic patterns shift or the affected provider addresses the congestion.
Step 4 — Is the Problem at the Destination Server
If every hop along the path shows normal latency but the very last hop — the destination — responds slowly or times out, the issue is on the remote server’s end. The path to it is clean, but the server itself is overloaded, rate-limiting ICMP traffic, or experiencing problems.
You can verify this by running tracert to a different destination. If the second trace completes with normal latency throughout, your connection is fine and the original destination server is the bottleneck. There is nothing to fix on your side in that scenario.

Tracert Command Options and Switches for Windows
The default tracert command works well for most situations, but Windows includes several optional switches that give you more control over how the trace runs. Each switch modifies a specific behavior.
tracert -d — Skip DNS Lookups for Faster Results
By default, tracert tries to resolve each hop’s IP address to a hostname using reverse DNS lookups. This can slow the trace significantly, especially when DNS servers are unresponsive or the lookup queue is long. Adding the -d flag skips hostname resolution entirely and displays only IP addresses:
tracert -d 8.8.8.8The trace output will complete noticeably faster. You lose the convenience of seeing router hostnames — which sometimes reveal the geographic location or ISP ownership of a hop — but when speed matters or DNS is behaving unreliably, this switch is the first one to reach for.
tracert -h — Set Maximum Number of Hops
The default maximum hop count is 30. If you know the destination is far away and may require more hops, or if you want to limit the trace to only the first few hops for a quick local network check, the -h flag lets you set the maximum:
tracert -h 10 8.8.8.8This stops the trace after 10 hops regardless of whether the destination has been reached. It is useful when you only care about diagnosing your local network and ISP hops without waiting for the full path to complete.
tracert -w — Change Timeout Per Hop
Each probe packet waits up to 4000 milliseconds (4 seconds) by default for a response before marking it as timed out. If you are tracing to a destination across a high-latency satellite link or a known slow path, you may want to increase this value. Conversely, you can shorten it to speed up traces on local or low-latency networks:
tracert -w 2000 8.8.8.8This sets the timeout to 2000 milliseconds per probe. Lowering the timeout means hops that would have responded in, say, 3500 ms will now show as timed out — so use this switch carefully.
tracert -4 and tracert -6 — Force IPv4 or IPv6
When you trace a domain name, Windows may choose either IPv4 or IPv6 depending on your network configuration and DNS resolution. To force a specific protocol, use:
tracert -4 google.com
tracert -6 google.com
The -4 flag forces an IPv4 trace, while -6 forces IPv6. This is particularly useful when troubleshooting connectivity issues that only affect one protocol. If your IPv6 path is broken but IPv4 works fine, tracing with -6 will reveal exactly where the IPv6 route fails.
When Tracert Results Are Misleading
Tracert is a powerful diagnostic tool, but it can easily lead to wrong conclusions if you do not understand its limitations. Several common patterns look like problems but are actually normal network behavior.
Why Asterisks Do Not Always Mean a Problem
As covered earlier, asterisks mean a router did not respond to the probe — not that your data is being dropped. Many enterprise and backbone routers are explicitly configured to ignore ICMP packets. Their job is to forward traffic at high speed, and responding to diagnostic probes is a low-priority task they are often configured to skip entirely. A row of asterisks surrounded by healthy hops above and below is standard behavior, not a fault.
Why High Latency on One Middle Hop Is Often Normal
A single hop showing inflated latency while subsequent hops return to normal is one of the most common causes of false alarms. This happens because the router’s data plane — the hardware responsible for forwarding packets at line speed — operates independently from its control plane, which handles ICMP responses. The control plane processes tracert replies using the router’s general-purpose CPU, which may be busy with management tasks. The result is a slow ICMP reply that does not reflect actual forwarding performance. If the latency does not persist through every hop after it, the router is forwarding your real traffic normally.
Why Some Routers Never Reply to Tracert
Certain network operators configure their routers to never respond to ICMP at all — not even with a TTL expired message. These hops show as a full row of asterisks on every trace, every time. Government networks, certain corporate transit providers, and security-hardened infrastructure commonly exhibit this behavior. It does not indicate a problem, and there is no way to force a response from those devices. As long as the trace eventually reaches the destination with acceptable latency, these silent hops can be safely ignored.
What to Do After Reading Tracert Results
Once you have identified where the latency spike or failure occurs, your next steps depend entirely on which part of the path is affected.
If the problem is at hop 1 — your local router — restart your router, check your Ethernet cable or Wi-Fi signal strength, and rule out local network congestion from other devices on your network. If latency at hop 1 is consistently high even with a wired connection, your router hardware may be failing or overloaded.
If the problem falls within your ISP’s hops (typically hops 2 through 4), save a copy of your tracert output with timestamps and contact your ISP’s support team. Showing them the exact hop where latency spikes — with proof that your local network is clean — moves the conversation past generic troubleshooting scripts and toward an actual infrastructure investigation on their end. Run multiple traces at different times of day to demonstrate whether the issue is consistent or tied to peak hours.
If the bottleneck is in a transit or backbone network beyond your ISP, there is very little you or your ISP can do directly. These issues typically resolve within hours or days as the upstream provider reroutes traffic or addresses congestion. Switching to a VPN can sometimes force your traffic through a different path that avoids the congested link — but this is a workaround, not a fix.
If the destination server itself is the problem — clean path, slow final hop — the issue is on the remote end. You can only wait for the server operator to resolve it.
For a broader understanding of how all these network layers connect and how to approach connectivity problems beyond tracert, the internet connectivity explained guide provides a structured overview.

Frequently Asked Questions
How do I read tracert results in Windows?
Each line after the header represents one hop — a router between your computer and the destination. Read left to right: the hop number comes first, followed by three round-trip time values in milliseconds, and finally the IP address or hostname of that router. Look for latency spikes that persist through all remaining hops to find where a problem exists.
What does * mean in tracert output?
An asterisk means that specific probe packet did not receive a response within the timeout period. A single asterisk among normal time values on the same hop is usually harmless. A full row of asterisks means the router at that hop refused to reply entirely, which is common behavior for security-hardened routers and does not necessarily indicate a fault.
What does Request Timed Out mean in tracert?
“Request timed out” appears when all three probe packets at a hop fail to get a response. Many routers are configured to drop ICMP packets to conserve processing resources. If the hops after the timed-out row respond normally and the destination is reached, the timed-out hop is not causing a problem.
Why does tracert show high latency on only one hop?
This typically happens when a router’s control plane — which handles ICMP replies — is slower than its data plane, which forwards your actual traffic at hardware speed. The router responds to tracert probes slowly, but your real data passes through it at full speed. If the latency spike does not carry forward to subsequent hops, it is not affecting your connection.
Does high latency on one tracert hop mean there is a problem?
Not if the hops after it return to normal latency. A genuine problem causes latency to jump at one hop and remain elevated through every hop that follows, including the destination. An isolated spike on a single middle hop with normal hops after it is almost always cosmetic.
What is the difference between tracert and traceroute?
tracert is the Windows command and uses ICMP Echo Request packets. traceroute is the Linux and macOS equivalent and typically uses UDP packets by default. Both trace the path to a destination hop by hop, but the protocol difference can occasionally produce slightly different results since some routers treat ICMP and UDP traffic differently.
How do I run tracert on Windows 11?
Open Command Prompt or Windows Terminal from the Start menu. Type tracert followed by an IP address or domain name — for example, tracert 8.8.8.8 — and press Enter. The trace begins immediately and prints each hop as it receives a response. Press Ctrl + C to cancel at any time.
How do I know which hop is causing my slow internet?
Scan the tracert output from top to bottom and find the first hop where latency jumps significantly. If that elevated latency continues on every hop after it through to the destination, the network link just before that hop is the bottleneck. If latency recovers on the next hop, the spike is cosmetic and not the cause of your slow connection.
What is a normal latency for each hop in tracert?
Your first hop — the local router — should respond in under 5 ms. ISP hops typically range from 5 to 20 ms. Regional hops may show 20 to 50 ms. Cross-country or international hops can reach 80 to 150 ms or more depending on physical distance. Latency should increase gradually. Sudden jumps of 100 ms or more that persist through all remaining hops indicate a congestion point.