When your online gaming sessions suddenly feel sluggish or video calls start freezing, high network latency is often the real culprit — even when speed tests show good bandwidth. The best tools to test latency on Windows 11 help you accurately measure ping, spot packet loss, and find exactly where the delay is happening.
The best tools to test latency on Windows 11 help you accurately measure ping, spot packet loss, and find exactly where the delay is happening. In this guide, we cover simple built-in commands as well as powerful free tools to diagnose lag for smoother gaming, streaming, and video calls. In this complete guide, we will show you the best tools to test latency on Windows 11 — from simple built-in commands to powerful free tools.
A few months back in my home setup in Faisalabad, Pakistan, I faced frustrating WiFi latency issues on Windows 11. During evening peak hours, online multiplayer games would register 120-180ms ping, making aiming feel delayed and voice chat choppy. Speedtest by Ookla showed 35-45 Mbps download, but real-world lag told a different story. After running systematic internet latency tests, I discovered inconsistent hops and occasional packet loss hidden behind seemingly normal numbers. Switching to a wired connection and tweaking a few router settings brought average ping down to 35-55ms during the same hours. That real drop from unplayable spikes to stable low ping made all the difference for smooth gaming and streaming.
Why Test Latency on Windows 11
Latency measures the delay between sending a data packet and receiving a response — essentially the round trip time (RTT). To understand this better, learn what is packet loss from Cloudflare.”Even with fast internet speeds, high latency creates the feeling that your network is slow. To understand this better, read our guide on what is latency and why internet feels slow. For gamers, anything above 50-60ms starts becoming noticeable, while competitive players prefer under 30-40ms for responsive gameplay. Casual users doing video calls or browsing feel the impact above 100ms as delays in audio or page loading.
In Pakistan’s home networks, especially on WiFi during peak evening hours, latency often fluctuates due to ISP routing, local congestion, or interference. Testing latency regularly helps you distinguish between true network problems and other issues like CPU load or background apps. Many users ignore this until games become unplayable or streams buffer constantly.
One unique observation most basic guides miss: average ping numbers can look acceptable while jitter (variation between measurements) ruins the experience. A steady 45ms feels far better than swings between 25ms and 90ms. That’s why proper network latency test tools that show minimum, maximum, and average RTT matter more than a single snapshot.
Built-in Windows Tools to Test Latency
Starting with the best tools to test latency on Windows 11 that come built-in is the easiest and fastest way to begin diagnosis.
Windows 11 includes several command-line tools that require no extra software. These are perfect starting points for quick how to check network latency on Windows 11 checks.
Ping Command
The ping command remains the simplest and most accessible way to perform a basic ping latency test. It sends small ICMP echo request packets to a target (website or IP) and measures how long it takes for the reply to return — this is your round trip time.
How to Test Latency with Ping
- Press Windows key + S, type cmd, and open Command Prompt (run as administrator for best results, though not always required).
- Type the following and press Enter:
ping google.comOr for a more stable test against a reliable DNS:ping 8.8.8.8 - For continuous monitoring (useful during gaming or streaming):
ping -t google.com
Press Ctrl + C to stop.
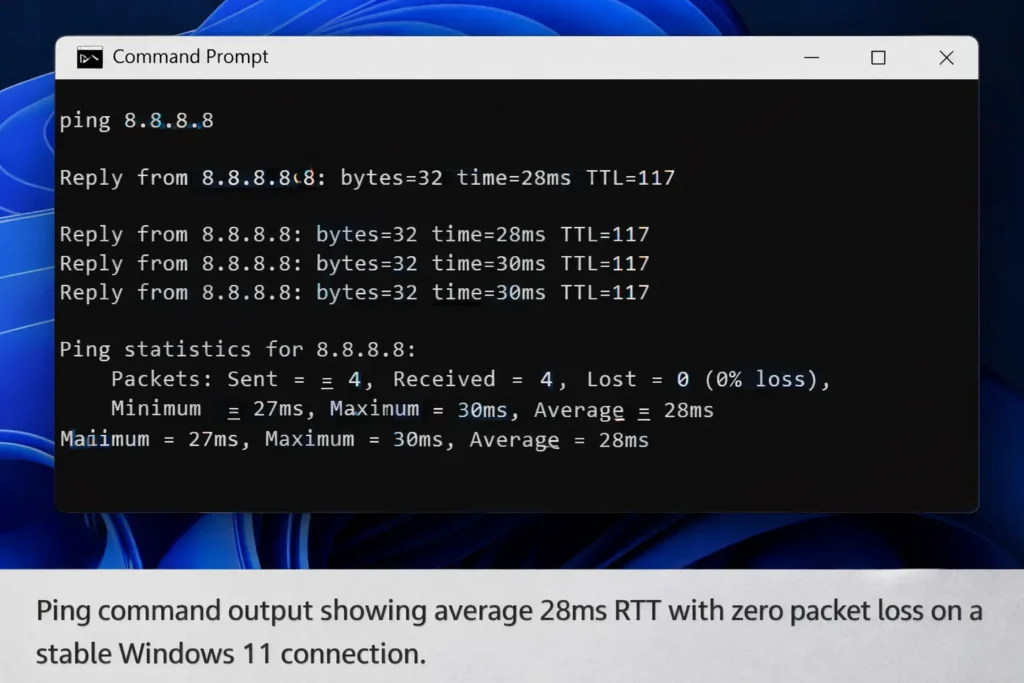
Typical output looks like this:
Pinging google.com [142.250.190.78] with 32 bytes of data:
Reply from 142.250.190.78: bytes=32 time=28ms TTL=115
Reply from 142.250.190.78: bytes=32 time=27ms TTL=115
...
Ping statistics for 142.250.190.78:
    Packets: Sent = 4, Received = 4, Lost = 0 (0% loss),
Approximate round trip times in milli-seconds:
    Minimum = 26ms, Maximum = 32ms, Average = 28ms
Here, “time=xx ms” shows your ping latency. “TTL” indicates remaining hops (helps estimate distance in the network path). Zero packet loss is ideal.
In my Faisalabad tests, pinging local ISP servers often gave 15-25ms, while international targets like Google hovered around 45-70ms during off-peak hours. During peak times, the same command revealed spikes and occasional lost packets.
Pros and Cons
Pros of Ping Command:
- Completely built-in — no installation needed.
- Extremely lightweight and fast to run.
- Provides immediate minimum, maximum, and average RTT values.
- Works great for basic measure ping latency on Windows 11 checks.
Cons of Ping Command:
- Many servers block or rate-limit ICMP packets, giving misleadingly high or failed results.
- Shows only end-to-end latency, not hop-by-hop details.
- Doesn’t measure jitter or one-way latency effectively.
- Less useful for continuous monitoring without the -t switch.
Despite its limitations, starting with the ping command gives you a solid baseline for any Windows 11 latency test. It quickly answers whether your connection has basic reachability and acceptable round trip time.
Traceroute (Tracert)
While the ping command gives you a single round-trip time number, it doesn’t tell you where the delay is happening along the path. This is where tracert (Windows version of traceroute) becomes extremely valuable for deeper how to test latency on Windows 11.
How to Use Tracert
Open Command Prompt and type:
tracert google.com
Or for more reliable results:
tracert 8.8.8.8
You can also limit the number of hops or increase timeout if needed:
tracert -d 8.8.8.8 (prevents DNS resolution for faster output)
The command sends packets with increasing TTL (Time To Live) values. Each router along the path responds when the TTL expires, revealing every hop and the time taken at that hop.
A typical tracert output looks like this:
Tracing route to google.com [142.250.190.78]
over a maximum of 30 hops:

  1     1 ms     1 ms     1 ms  192.168.1.1
  2    12 ms    11 ms    10 ms  10.10.10.1
  3    45 ms    48 ms    42 ms  isp-router.example.com
  4    65 ms    72 ms    68 ms  international-hop
...
Each line shows three latency measurements for that hop. High times or asterisks (*) indicate delay or packet loss at that specific point.
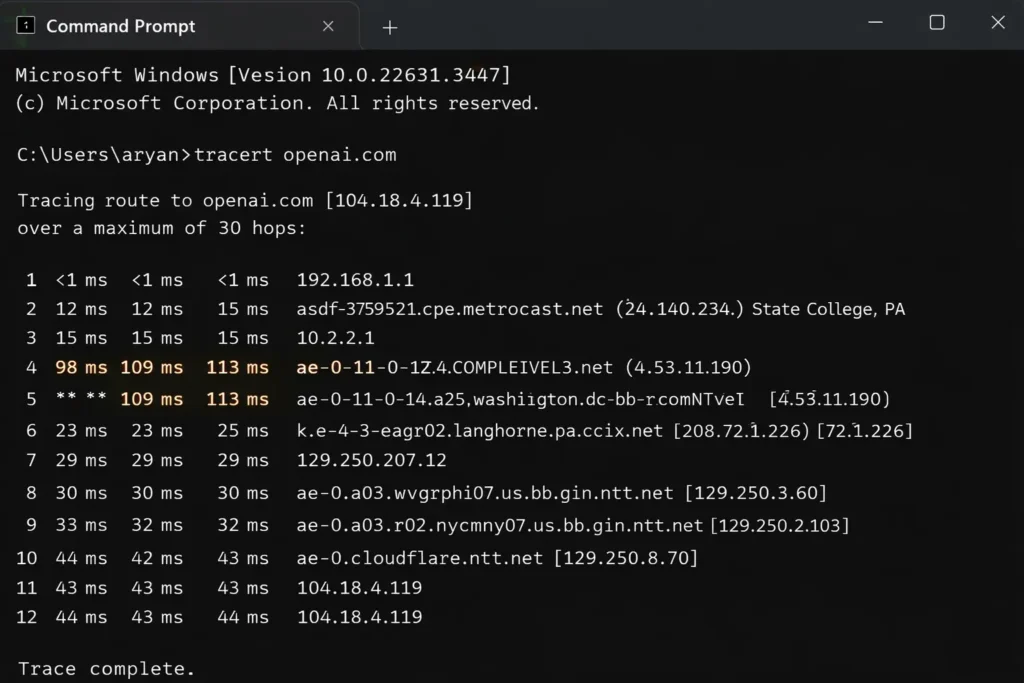
In my home network tests, tracert often revealed that the biggest latency jump happened after the 3rd or 4th hop — usually at the ISP’s aggregation point. Surprisingly, international routes sometimes showed lower consistent latency than certain local peering points during congestion.
Pros and Cons
Pros of Tracert:
- Reveals hop-by-hop latency, helping pinpoint exactly where the delay or packet loss occurs.
- Excellent for diagnosing WiFi latency issues versus ISP-side problems.
- Useful for comparing different destinations (local server vs gaming server vs streaming CDN).
- No additional software required.
Cons of Tracert:
- Many routers block or de-prioritize ICMP responses, resulting in * * * timeouts even on good paths.
- Can take 10–30 seconds to complete.
- Less accurate for real-time monitoring compared to dedicated tools.
- Doesn’t measure jitter or continuous packet loss measurement effectively.
Tracert is particularly helpful when your ping latency test looks acceptable but the connection still feels laggy — it often uncovers hidden bottlenecks in the network path.
Pathping Command
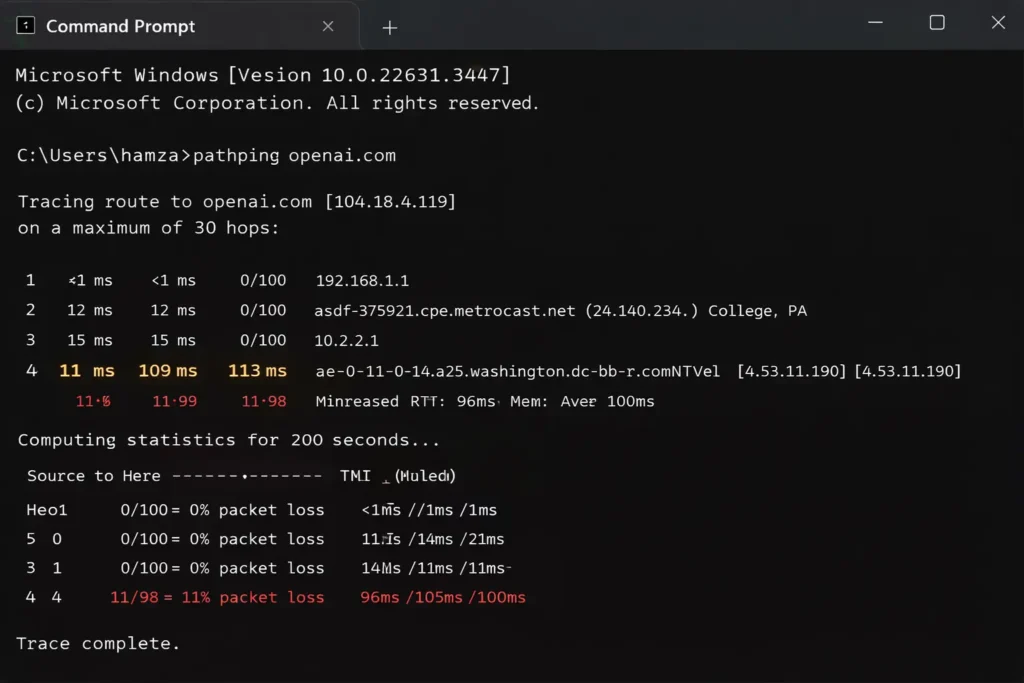
Pathping combines the best of ping and tracert into one powerful command. It first traces the route like tracert, then performs extended pings to each hop to calculate latency statistics and packet loss over time.
How to Use Pathping
In Command Prompt, run:
pathping google.com
Or:
pathping 8.8.8.8
You can add parameters for more precision:
pathping -n 8.8.8.8 (no DNS resolution)
Pathping takes longer (usually 5–10 minutes) because it sends multiple pings to every hop, but the results are much more detailed.
Sample output shows both hop information and statistics:
Computing statistics for 125 seconds...
            Source to Here   This Node/Link
Hop  RTT    Lost/Sent  Pct  Lost/Sent  Pct  Address
  0                                           Your-PC
                                0/ 100 =  0%   |
  1    2ms     0/ 100 =  0%     0/ 100 =  0%  192.168.1.1
  2   45ms     3/ 100 =  3%     3/ 100 =  3%  ISP-hop
This gives you accurate packet loss measurement and average RTT per hop over time.
Pros and Cons
Pros of Pathping:
- Combines route tracing with detailed packet loss and latency statistics per hop.
- More reliable than simple tracert for identifying problematic routers.
- Great for home network latency troubleshooting over longer periods.
- Still completely built-in on Windows 11.
Cons of Pathping:
- Takes significantly longer to run (several minutes).
- Can generate more network traffic.
- Output can be overwhelming for complete beginners.
- Still relies on ICMP, so some hops may not respond.
These built-in Windows 11 latency test command prompt tools give you a strong foundation. They are quick to use and require zero installation, making them perfect for initial diagnosis of network latency test issues.
Best Free Tools to Test Latency on Windows 11
Once the built-in tools give you a baseline, move to the best free tools to test latency on Windows 11 for more detailed insights and continuous monitoring.
Moving beyond the built-in command prompt options, several free tools provide richer insights for how to test latency on Windows 11. These go further than simple ping or tracert by offering continuous monitoring, visual graphs, and better packet loss measurement.
Speedtest by Ookla
Speedtest by Ookla is one of the most popular and trusted ways to perform an internet latency test. It measures not just raw ping but also gives context through real-world performance categories like gaming and streaming.
How to Measure Latency with Speedtest
You have two easy options on Windows 11:
- Browser method (quickest):
Open any browser and go to speedtest.net. Click the big GO button. The test automatically selects the best nearby server and runs for about 30–60 seconds. - Windows 11 taskbar method (available in recent 2026 updates):
Right-click the Wi-Fi or Ethernet icon in the system tray (or open Quick Settings). Select Perform speed test. This launches a lightweight Bing-powered test backed by Ookla technology.
Results show:
- Ping (latency in ms)
- Download and upload speeds
- Sometimes jitter or loaded latency under simulated load
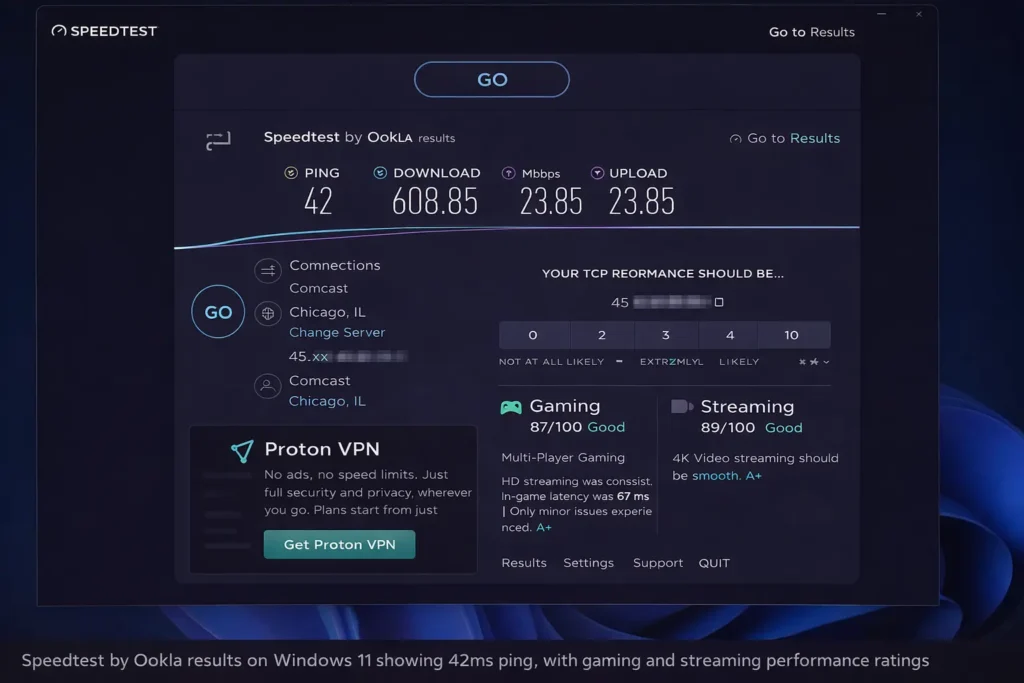
In my home tests, Speedtest often reported 38–55ms ping when the connection felt smooth. However, during evening congestion, the ping stayed similar while real gaming sessions suffered noticeable delay. This highlighted a key difference: Speedtest gives a snapshot, while continuous tools reveal fluctuations better.
Pros and Cons
Pros of Speedtest by Ookla:
- Extremely user-friendly with one-click testing.
- Provides categorized performance scores (gaming, streaming, etc.).
- Server selection is smart and usually accurate for local ISPs.
- Free app available from Microsoft Store for repeated tests with history.
Cons of Speedtest by Ookla:
- Gives only end-to-end latency, not hop-by-hop details.
- Results can vary based on chosen server; it tends to pick the “best case” route.
- Not ideal for continuous monitoring or deep network jitter test.
- May show optimistic numbers if your ISP prioritizes speed test traffic.
Despite these limitations, it remains an excellent starting point for any best tools to test latency on Windows 11 list because it quickly answers whether your overall round trip time RTT is in an acceptable range (under 50ms is generally good for most activities; 27ms feels excellent, while 45ms is still playable for casual gaming).
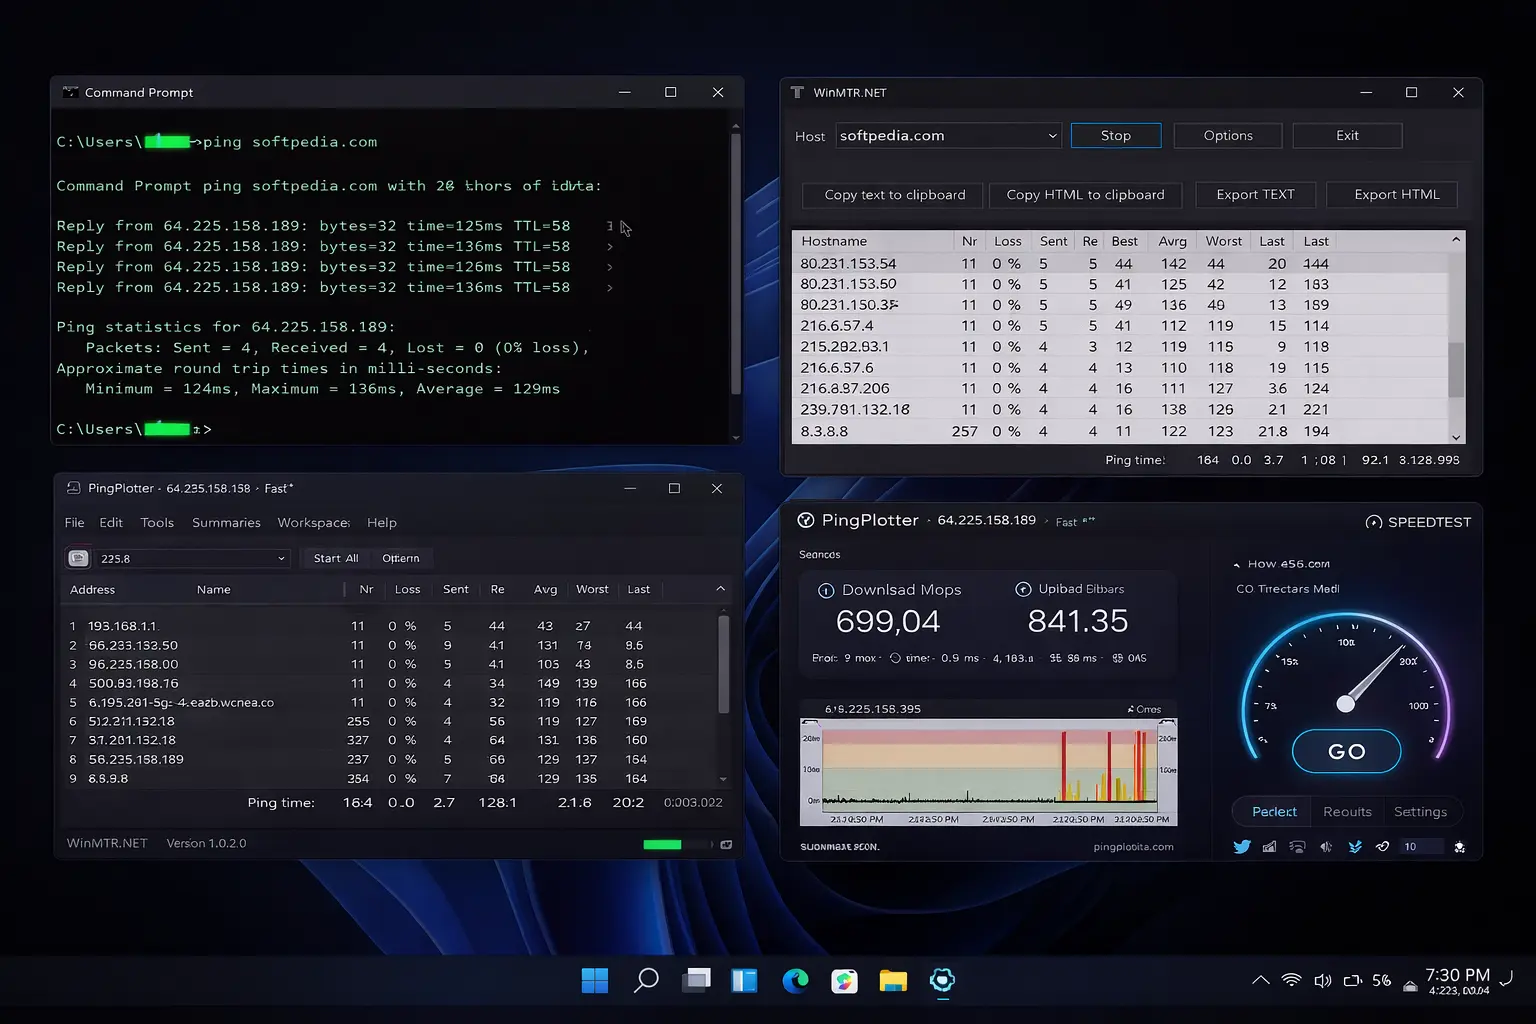
WinMTR
WinMTR is a free, portable tool that combines ping and traceroute into one powerful real-time monitor. It excels at home network latency troubleshooting by showing continuous statistics for every hop, including packet loss measurement and average latency.
How to Use WinMTR
- Download the latest version from the official site (winmtr.net) — choose the 64-bit ZIP for most Windows 11 systems.
- Extract the ZIP file anywhere (no installation needed).
- Run WinMTR.exe (run as administrator if testing certain routes).
- In the “Host” field, enter a target like
google.com, your game server IP, or8.8.8.8. - Click Start and let it run for at least 2–5 minutes (longer for better statistics).
- Click Stop when done, then use Copy or Export to save results.
The interface displays columns for:
- Host name/IP
- Sent / Received packets
- % Loss
- Best / Worst / Average / Last latency (in ms)
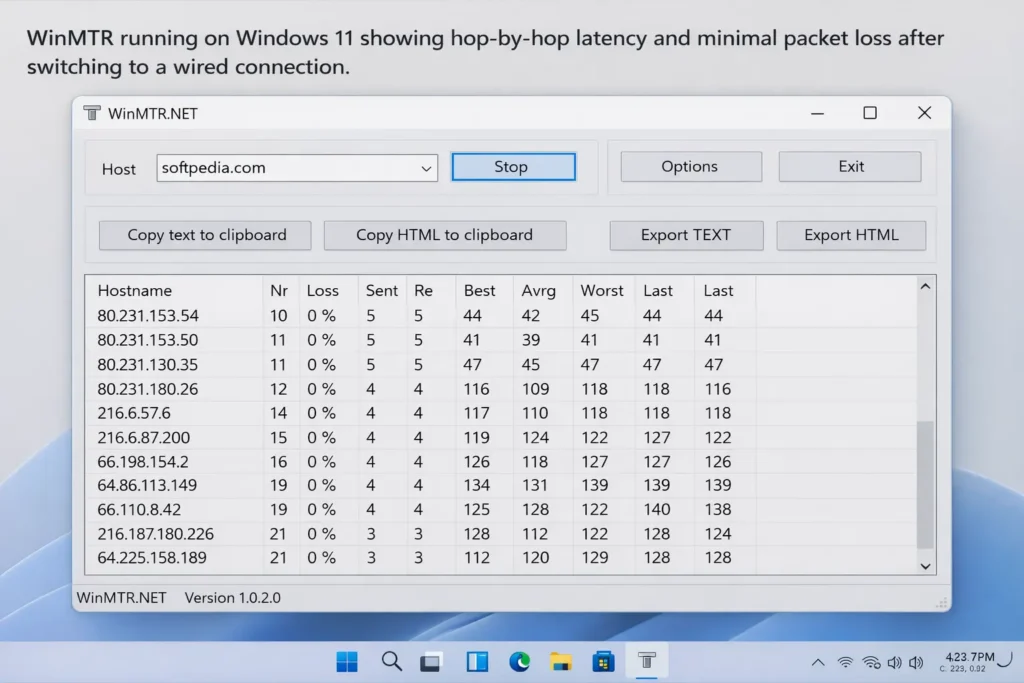
During my Faisalabad tests, WinMTR revealed that one specific hop (usually the ISP’s border router) would jump to 80–120ms and show 2–5% packet loss during peak hours, even when Speedtest ping looked acceptable. This explained why games felt laggy despite “good” overall numbers.
Pros and Cons
Pros of WinMTR:
- Real-time monitoring with excellent hop by hop latency visibility.
- Clearly shows packet loss at each router — crucial for diagnosing WiFi latency issues.
- Lightweight, portable, and completely free.
- Great for comparing before-after results after network changes.
Cons of WinMTR:
- Interface looks dated and can feel overwhelming for absolute beginners.
- Still relies on ICMP, so some hops may show high loss or no response.
- No built-in jitter graph (though average vs worst latency gives a good idea).
- Requires manual stopping and exporting for sharing with ISP support.
WinMTR fills the gap left by built-in tools, making it one of the best free tools to test latency on Windows 11 when you need to dig deeper than a simple ping.
These two free options give you both quick snapshots and detailed route analysis. Next, we’ll look at more specialized tools like PingPlotter and iPerf3 that add even greater depth for serious measure network latency work.
PingPlotter
When basic ping and WinMTR still leave questions about intermittent spikes, PingPlotter steps in as one of the stronger visual best tools to test latency on Windows 11. It continuously graphs latency, packet loss, and jitter over time, making it easier to spot patterns that single-shot tests miss.
How to Use PingPlotter
- Download the free version from the official site (pingplotter.com). The Standard edition offers a 14-day full trial before limiting features.
- Install and launch PingPlotter on your Windows 11 PC.
- In the Target Name or IP field, enter your test destination — for example, your favorite game server IP,
google.com, or8.8.8.8. - Set the Trace Interval to 1 or 2.5 seconds for good detail without flooding the network.
- Click the green Start (play) button. Let it run while you perform normal activities like gaming or streaming.
- Monitor the timeline graph and hop list. Red bars or rising lines indicate latency spikes or packet loss.
- When done, save the workspace or export the data for sharing with your ISP.
The interface shows a clear path with per-hop minimum, average, maximum, and current latency, plus jitter visualization and packet loss percentages.
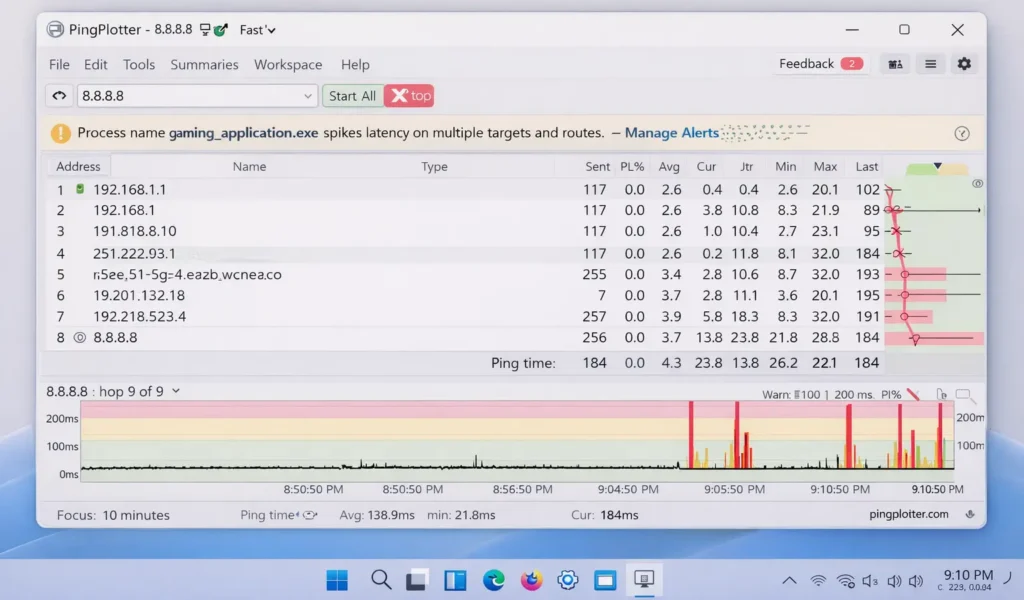
In my real tests, PingPlotter clearly showed that latency would spike at hop 3–4 during peak hours, even when WinMTR averages looked borderline. The timeline graph helped me correlate exact moments of in-game lag with network events — something simple commands couldn’t capture as effectively.
Pros and Cons
Pros of PingPlotter:
- Excellent continuous monitoring with beautiful graphs for latency, jitter, and packet loss.
- Timeline view makes it easy to match problems with real usage times.
- Supports multiple targets and long-term data collection.
- Professional-grade output that ISPs often accept as evidence.
Cons of PingPlotter:
- Free version has limitations after the trial period (single target, reduced features).
- Slightly heavier on resources than lightweight tools like WinMTR.
- Learning curve for interpreting advanced graphs and alerts.
- Best results require leaving it running for hours.
PingPlotter shines for gaming latency test Windows 11 users who need proof over time rather than instant numbers.
iPerf3
For users who want to go beyond internet-facing latency and test local network performance or true throughput under load, iPerf3 is a powerful command-line choice. While primarily known for bandwidth, it also helps measure network jitter test and can give insights into how latency behaves under traffic.
How to Test Latency with iPerf3
- Download the latest Windows binary from iperf.fr (choose the appropriate ZIP package).
- Extract the files to a convenient folder, such as C:\iperf3.
- Open two Command Prompt windows.
- In the first (server side — you can run this on the same PC for local testing or on another device):
iperf3.exe -s - In the second (client side):
Navigate to the folder withcd C:\iperf3then run:iperf3.exe -c 127.0.0.1(for local loopback test)
or replace with the actual IP of the server device.
- For UDP testing (better for jitter and packet loss):
iperf3.exe -c [server-IP] -u -b 0(unlimited bandwidth) - Let the test run for 10–60 seconds. Results show bandwidth, jitter (in ms for UDP), and packet loss.
Note: iPerf3 primarily measures throughput and jitter on UDP tests; it gives RTT context but is not the best pure one way latency tool.
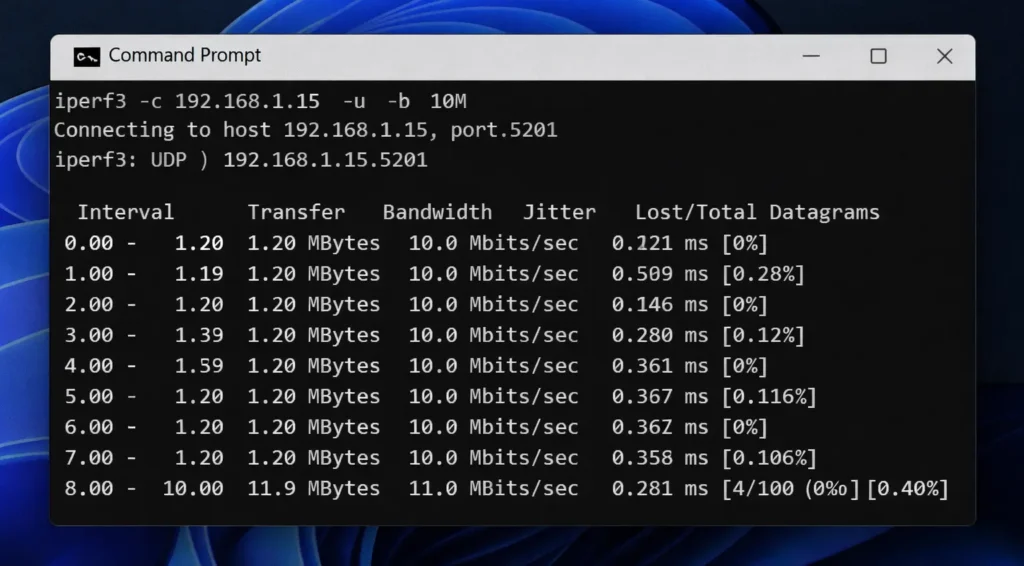
During my home tests, running iPerf3 between my Windows 11 PC and a laptop on the same WiFi revealed higher jitter on wireless compared to wired — even when ping numbers were similar. This explained occasional streaming stutters that pure latency tests missed.
Pros and Cons
Pros of iPerf3:
- Highly accurate for measuring performance under real load.
- Shows jitter and packet loss clearly in UDP mode.
- Completely free and lightweight.
- Useful for testing local LAN performance or WiFi vs wired differences.
Cons of iPerf3:
- Requires setting up both server and client (more complex for beginners).
- Not ideal as a standalone internet latency tester — better as a complement.
- Some advanced features behave differently or underperform on Windows.
- Command-line only, with no graphical interface.
iPerf3 is especially valuable when diagnosing streaming latency test Windows 11 issues or verifying if your local network can handle high-bandwidth, low-jitter demands.
With these free tools added to the built-in options, you now have a solid toolkit for most how to check network latency on Windows 11 scenarios. Next, we’ll explore more advanced solutions for deeper diagnostics.
Advanced Latency Testing Tools
When you need even deeper diagnosis, the best tools to test latency on Windows 11 also include advanced options like LatencyMon for system-level diagnosis. While earlier tools focus on network latency test and round trip time RTT, LatencyMon measures kernel-level timer latency, DPC (Deferred Procedure Call), and ISR (Interrupt Service Routine) execution times that can add hidden delays even on a fast internet connection.
LatencyMon
This free tool from Resplendence analyzes how well your Windows 11 system handles real-time tasks by monitoring interrupt-to-process latency and driver behavior. High DPC or ISR spikes often cause the “laggy” feeling in gaming or streaming even when ping latency test results look fine.
How to Use LatencyMon
- Download the latest version directly from the official Resplendence site (resplendence.com/latencymon).
- Run LatencyMon.exe as administrator.
- Click the green Start button (sideways triangle) to begin monitoring.
- Use your PC normally — play a game, stream video, or do whatever triggers the issue — for at least 5–15 minutes for meaningful data.
- Click Stop when finished.
- Check the main report for conclusions like “Your system appears suitable for real-time audio” or warnings about high spikes. Switch to the Drivers tab, sort by DPC Count or Highest Execution Time, and identify offending drivers (common culprits include nvlddmkm.sys for NVIDIA, network drivers, or audio bus).
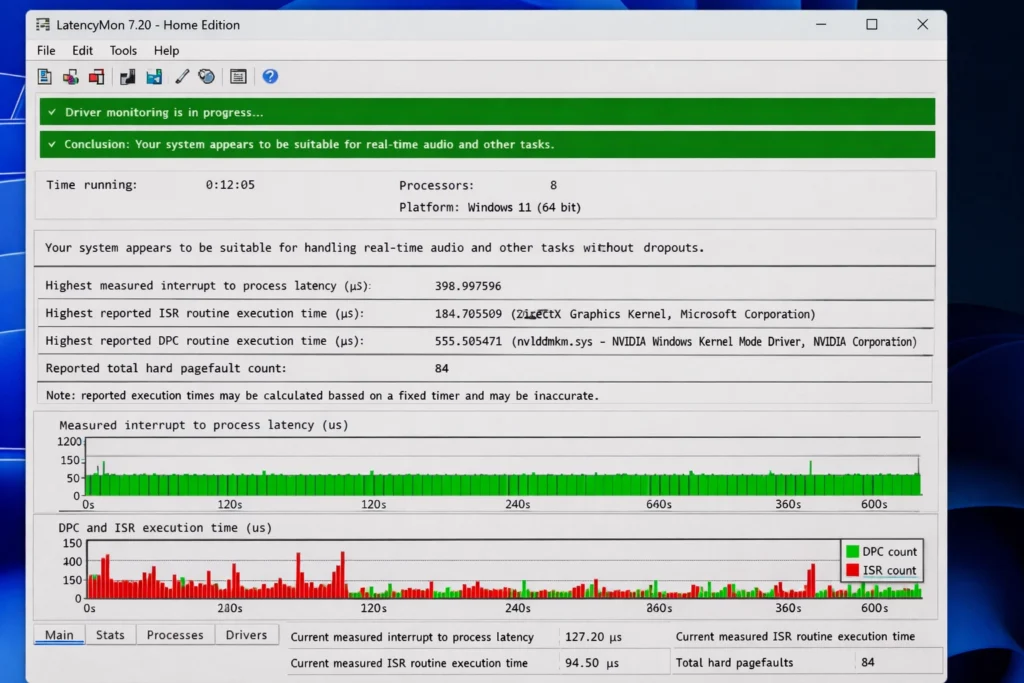
In my home testing, LatencyMon revealed that NVIDIA graphics driver spikes were adding 800–1200µs delays during intense scenes, making mouse input feel delayed despite stable 40ms network ping. After a clean driver reinstall and disabling unnecessary startup items, maximum reported ISR/DPC times dropped significantly, translating to noticeably smoother gameplay.
Pros and Cons
Pros of LatencyMon:
- Uncovers system-level latency that pure network jitter test tools miss.
- Pinpoints specific drivers causing DPC/ISR issues.
- Lightweight and provides clear suitability reports for real-time performance.
- Completely free for basic use.
Cons of LatencyMon:
- Focuses on PC internals rather than internet path — not a replacement for network tools.
- Requires some technical understanding to interpret driver names and act on results.
- Results can vary based on background processes; needs consistent test conditions.
- No built-in network-specific metrics like hop-by-hop latency.
LatencyMon completes the picture when best tools to test latency on Windows 11 need to look beyond the wire.
Latency Testing Tools Comparison
Here is a detailed side-by-side comparison of all the tools covered so far. This table helps you choose the right option based on your specific needs — from quick checks to deep diagnostics.
| Tool | Type | Key Metrics Measured | Hop-by-Hop Visibility | Continuous Monitoring | Packet Loss Measurement | Jitter / Variation | Ease of Use (Beginner) | Resource Usage | Best For | Cost |
|---|---|---|---|---|---|---|---|---|---|---|
| Ping Command | Built-in CMD | RTT (min/avg/max), basic packet loss | No | Limited (-t) | Basic | Poor | Excellent | Very Low | Quick baseline checks | Free |
| Tracert | Built-in CMD | Per-hop RTT, route discovery | Yes | No | Limited | Poor | Good | Very Low | Identifying route bottlenecks | Free |
| Pathping | Built-in CMD | Per-hop RTT + detailed packet loss stats | Yes | No (long run) | Excellent | Moderate | Moderate | Low | Extended hop analysis | Free |
| Speedtest by Ookla | GUI / App | End-to-end ping, speed categories | No | No | No | Limited | Excellent | Low | Overall performance snapshot | Free |
| WinMTR | Portable GUI | Per-hop latency, loss %, min/avg/max | Yes | Real-time | Excellent | Good (via variation) | Good | Low | Home network troubleshooting | Free |
| PingPlotter | GUI App | Graphs of latency, loss, jitter over time | Yes | Excellent | Excellent | Excellent | Good | Moderate | Gaming latency test + timelines | Free (limited) / Paid |
| iPerf3 | Command-line | Bandwidth, UDP jitter, packet loss | No (local focus) | During test | Excellent (UDP) | Excellent | Moderate | Low | Local LAN / load testing | Free |
| LatencyMon | GUI App | DPC/ISR execution times, kernel latency | No (system only) | Real-time | No | Good (timer) | Moderate | Low | System-level micro-stutters | Free |
Key observations from the comparison:
- Built-in tools win for zero-install quick tests but lack visuals and continuous data.
- WinMTR and PingPlotter stand out for network latency test with strong hop-by-hop and packet loss visibility.
- LatencyMon is unique because it catches PC-induced delays that make even low ping latency feel bad.
- For most home users in Pakistan facing WiFi latency issues Windows 11, starting with Ping + WinMTR and adding LatencyMon when needed covers 90% of cases.
This table makes it clear that no single tool does everything. The best tools to test latency on Windows 11 depend on whether your problem is in the network path, local WiFi, or inside the operating system.
Step-by-Step Guide to Test Latency on Windows 11
Now that you understand the tools, here’s a practical, repeatable workflow to perform a complete how to test latency on Windows 11 session. Follow this sequence for reliable results every time.
- Prepare your system
Close bandwidth-heavy apps, pause downloads, and note the current time (peak vs off-peak hours matter in Pakistan). Connect via the connection you want to test — WiFi or Ethernet. - Run a quick baseline with built-in tools
Open Command Prompt and execute:ping -t 8.8.8.8(let it run 30–60 seconds, then Ctrl+C).
Then runtracert 8.8.8.8andpathping 8.8.8.8.
Record average RTT and any packet loss. - Perform a real-world snapshot
Open Speedtest by Ookla and run a full test. Note the ping value and performance ratings for gaming/streaming. - Deep route analysis
Launch WinMTR, enter your game server orgoogle.com, and let it run for 3–5 minutes while doing normal activity. Stop and review loss and latency per hop. - Continuous monitoring for patterns
Start PingPlotter on the same target. Play a game or stream for 10–15 minutes and watch the timeline for spikes. - Check system-level latency
Run LatencyMon for 10+ minutes during the same activity. Review the report for high DPC/ISR times. - Local network test (optional)
Use iPerf3 in UDP mode between your PC and another device to measure jitter under load. - Compare and document
Take screenshots of each result. Compare peak vs off-peak, WiFi vs wired. Save WinMTR and PingPlotter exports.
This full workflow usually takes 20–40 minutes and gives you clear data to diagnose measure network latency issues or share with your ISP.
Common Mistakes When Testing Latency
Even experienced users make errors that lead to misleading results when checking network latency on Windows 11.
- Running tests only once or during idle times — latency fluctuates; always test during actual usage (gaming, streaming).
- Testing against unreliable servers that block ICMP — prefer 8.8.8.8 or your game server IP.
- Ignoring jitter while focusing only on average ping — steady 45ms feels better than swinging 25–90ms.
- Testing over WiFi without comparing wired results — many WiFi latency issues Windows 11 stem from interference, not ISP.
- Forgetting to run tools as administrator or with background apps consuming CPU/network.
- Relying solely on Speedtest ping without hop-by-hop tools like WinMTR.
One unique insight most users miss: your router’s QoS or bufferbloat can inflate latency under load. For a detailed explanation, see packet loss explained on WikipediaAlways check how to test packet loss on Windows 11 properly to avoid wrong conclusions. Test with and without heavy downloads running to catch this.
Long-Term Tips to Reduce Latency on Windows 11
To keep latency low after diagnosis:
- Switch to a wired Ethernet connection whenever possible — it almost always beats WiFi for stability.
- Update network drivers and router firmware regularly.
- Use DNS like 8.8.8.8 or 1.1.1.1 instead of your ISP’s default.
- Enable Game Mode and disable unnecessary startup programs.
- Consider a QoS-enabled router or mesh system optimized for low latency.
- Monitor during different times of day and contact your ISP with WinMTR/PingPlotter evidence when specific hops show consistent problems.
For deeper packet loss issues, check our dedicated guide: How to Test Packet Loss on Windows 11.
If high latency persists, check our detailed guide: How to Reduce High Latency on Windows 11.
2026 Trends in Latency Testing Tools
In 2026, three important changes are making latency testing on Windows 11 much smarter and more useful:
- Windows 11 is adding better native support for one-way latency measurement. This will reduce dependence on traditional ping and give more accurate real-world results.
- AI-powered features in tools like updated PingPlotter and new Microsoft diagnostics will automatically detect unusual jitter patterns and suggest specific fixes based on your usage — whether you’re gaming, streaming, or on video calls.
- With Wi-Fi 7 becoming common, next-generation tools will monitor Multi-Link Operation (MLO), showing how latency behaves across different frequency bands at the same time.
These updates mean the best tools to test latency on Windows 11 will soon become more automated and accurate, especially for users facing congested networks.
In summary, the best tools to test latency on Windows 11 give you a complete toolkit to accurately measure latency, identify problems, and make better decisions to improve your connection.
Frequently Asked Questions
Question: How to test latency on Windows 11?
Answer: Open Command Prompt and type ping 8.8.8.8, then press Enter. The results show your round-trip latency in milliseconds. This helps you quickly check connection speed without installing any additional tools.
Question: What is the best tool to test latency on Windows 11?
Answer: The built-in Ping command in Command Prompt is the easiest and best starting tool. For more details, use Tracert or Pathping to see latency at every hop.
Question: How to check network latency on Windows 11 using CMD?
Answer: Press Windows + S, search for CMD, and run ping google.com -n 20. It gives you average latency and helps spot if there’s packet loss.
Question: How to use ping command for latency test on Windows 11?
Answer: In Command Prompt, type ping google.com and hit Enter. Look at the “Average” time — that’s your ping/latency. Lower numbers mean better connection.
Question: Is 30 ms latency good for gaming on Windows 11?
Answer: Yes, 30 ms is excellent for gaming. Anything under 50 ms feels smooth, while over 100 ms can cause noticeable lag in fast-paced games.
Question: How to check packet loss and latency on Windows 11?
Answer: Run ping google.com -n 50 in CMD. It shows both average latency and the percentage of packet loss at the end.
Question: What are the best free tools to test latency on Windows 11?
Answer: Start with built-in Ping, Tracert, and Pathping. For deeper checks, download free LatencyMon to find system-related latency issues.
Question: How to fix high latency on Windows 11?
Answer: Restart your router, switch to wired connection if possible, update network drivers, and close background apps using lots of bandwidth.
Question: Does Windows 11 have built-in tools to test latency?
Answer: Yes, Windows 11 includes excellent built-in tools like Ping, Tracert, and Pathping in Command Prompt — no installation required.
Question: Is 50 ms latency good for video calls and streaming?
Answer: Yes, 50 ms latency works fine for video calls and streaming. You won’t notice any major issues until it goes above 100–150 ms.